ArticleStewardship Economics10 min read
The Land the UK Cannot Spend Twice
A back-of-the-envelope calculation says the UK would need more cropland than it has to feed itself. Population, diets, nature, net zero and housing all pull on the same fixed land area with uneven force.
In brief
- Feeding the UK from its domestic crops would take roughly 7 to 11.6 million hectares of cropland, against 6.1 million croppable.
- The UK added 227,700 people in the year to mid-2025, and about 85% of its farmland serves animal feed or livestock: demography and use, both move the land allocation through market dynamics.
- The Royal Society's illustrative estimate is that the UK could need up to 1.4 million hectares more land by 2030 to meet net zero and biodiversity targets, if production, diets and waste stay static.
- Housing is settled by permission and price. Food, nature and climate goals depend on policy rules to govern allocations. The outcome depends on who participates in writing the rules.
The last time Westminster wrote a national rulebook for what the land is for was 1947. The Town and Country Planning Act brought development under public control in England and Wales, and the Agriculture Act of the same year guaranteed prices to keep farming productive.1 They were ambitious and comprehensive, written for a country that expected to grow a large part of its own food, house its people, and develop responsibly. Nearly eighty years on, the planning system that began there is still with us, amended many times. The country it was designed for is not.
Drive through the British countryside and the fields roll past between towns. Pick up a supermarket broccoli and the label says British. It is easy to assume the country feeds itself. The arithmetic says otherwise.
The United Kingdom has 69.5 million people.2 It has 16.8 million hectares of farmland, of which 6.1 million can grow crops.3 The world's cropland currently feeds about six people a hectare — a crude world average, struck after the grain that goes to livestock and the crops that go to fuel tanks are taken out.4 Divide the population by that figure and you get about 11.6 million hectares of cropland, close to half the country. The same study finds that the crops grown would feed about ten people a hectare if every calorie went to people, a ceiling no food system reaches.4 That brings the answer to just under seven million hectares of cropland.
So between seven and 11.6 million hectares of cropland would be needed to feed the nearly 70 million people of the UK. Both ends sit above the 6.1 million hectares the UK actually has. UK yields, driven by high-intensity inputs, have historically beaten the world's, so treat this as a rough estimate, and the low end, which assumes no calorie is lost, as a best case. Even before the rising effect of climate change on yields — a growing challenge for farmers — the order of magnitude is clear.5 And the sum moves with the demography: the UK added 227,700 people in the year to mid-2025, 0.33%, which at six to ten people a hectare is roughly 23,000 to 38,000 hectares of cropland a year, on our estimation.2 The UK does not try to feed itself in any case: Defra puts home production at 60% of food by value in 2025, down from 65% the year before.6 What is not grown domestically is grown on someone else's hectares. Imports do not abolish the constraint. They move it off the map, onto land that other countries decide how to use.
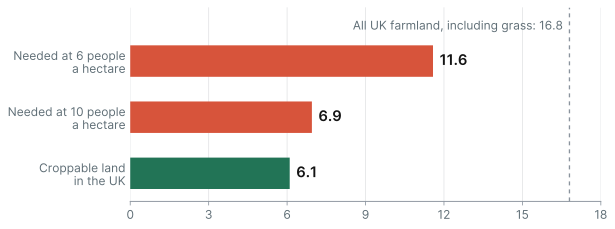
Cropland needed for 69.5 million people at the two yields in Cassidy et al., against Defra's croppable area, in millions of hectares. All UK farmland, including grass, is 16.8 million. For illustration only.
Source: Cassidy et al. (2013); ONS mid-2025 population; Defra (2025), processed and compiled by Natropy
What the land is for
This calculation sets the scale. It shows the constraint. And from constraints, trade-offs emerge. The biggest one here is diet.
Defra estimates that 85% of UK farmland went to animal feed or livestock in 2023, counting all grassland and 58% of the croppable area.7 The land question is, to a large degree, a question about what the market demands, of which diet is the most visible part.
One published scenario shows how far the allocation can move. The Centre for Alternative Technology's Zero Carbon Britain — a campaigning organisation's scenario, not peer-reviewed — feeds the country on a plant-rich diet from 4.6 million hectares of cropland, about what is used today, and 2.8 million of grass, while importing 17% of its food instead of 42%.8 That is under half of today's farmland. Diet frees grass far more than it frees arable, because the cropland stays busy growing food for people in place of feed. This is not a case for any plate. It shows how the arithmetic moves when the allocation does.
This way of reasoning has a blind spot. It is reactive, not proactive. And it assumes demand would align with the arithmetic. Demand is settled by market dynamics in the face of choice, not by calculations that attempt to maximise how many people a fixed quantity of land can carry.
Also, hypothetically, if the response to demographic growth were to convert grass to arable — which Defra regards as generally impractical, given soils, weather and economics7 — it raises three questions:
- How can an increase in arable land be compatible with the need to reverse biodiversity decline?
- How can the food security constraint reduce over time if demographic growth continues?
- What is civil society's response to an increase in population density and a reduction of dietary choice?
These are legitimate and important questions that any country must confront when nearing physical limits.
Four claimants, one field
Allocation is a trade-off, and markets settle most trade-offs by price. Land is a partial exception: the state has constrained its use through planning since 1947, and new constraints are arriving. None of this would matter if the land were idle. It is not. Farming alone covers 69% of the United Kingdom,3 and in England farmland, woods and open land together cover 83%.9 Food has the first claim, and three more claimants have arrived with paperwork.
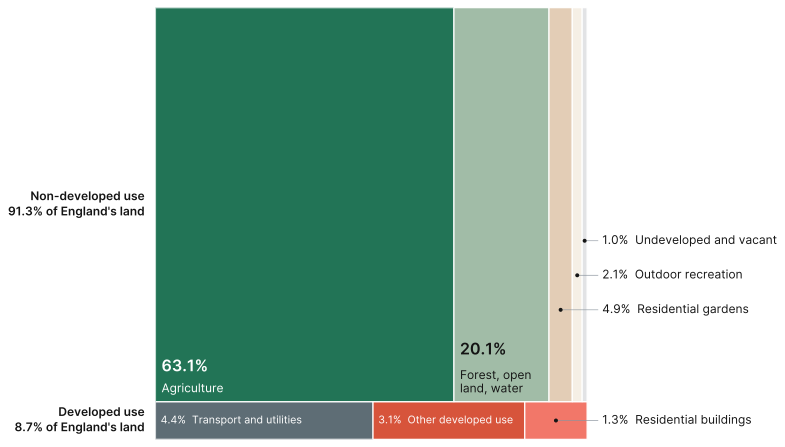
Land use in England, April 2022. Each rectangle's area is its share of England's land.
Nature is the first. In 2022, governments, the UK among them, agreed to protect 30% of land and sea by 2030.10 About 10.6% of UK land was formally protected in March 2025.11 Net zero is the second. The Climate Change Committee's Seventh Carbon Budget needs 10% of UK agricultural land for land-based measures by 2040 and 19% by 2050, as fewer cattle and sheep release land for woodland, peatland and energy crops. Woodland cover rises from 13% of UK land to 16% by 2040 and 19% by 2050, with 0.7 million hectares of energy crops by 2050.12 Housing is the third. In December 2024 the government set a target of 1.5 million homes during the Parliament elected in July of the same year, and told councils to review green belt boundaries, prioritising lower quality "grey belt" land.13 Estimating 20 to 40 homes a hectare, that is 38,000 to 75,000 hectares: a small area and a large argument.
These ambitions, taken in isolation, are reasonable, even logical and laudable. Planning, farming and land use are devolved, so no single government holds the whole picture. Added together they are harder. The closest estimate we found is the Royal Society's: up to 1.4 million hectares of additional land would be needed by 2030 to meet current policy targets for net zero and biodiversity, if agricultural production, diets and food waste stay as they are, and 4.4 million by 2050, 18% of UK land.14 The Society calls these figures illustrative, and they rest on assumptions about how far different uses can overlap. Few studies have tried to engage in the reconciliation, and it is easy to see why. Why study a problem that can only be solved with trade-offs when none of them is appealing?
The map and the price list
When one faces a conundrum, it often matters more to understand how it emerged than to suppress the inconvenience it poses. So why is the land not divided more deliberately? What has tilted the patchwork of land-use away from food security and biodiversity?
Partly because the price list and the "ideal" map disagree. ONS valued the land under the UK's homes at £5.4 trillion in 2020, out of £6.3 trillion for all land: about 86%.15 In England, homes and their gardens take up about 6% of the land.9 The value is a UK figure and the area an English one, so the comparison is rough, but the picture is plain enough. About 6% of the map carries 86% of the value.
The reason is permission, not use. A hectare of wheat and a hectare with consent for houses are different assets. The uplift from planning consent is among the best-documented effects in housing economics.16
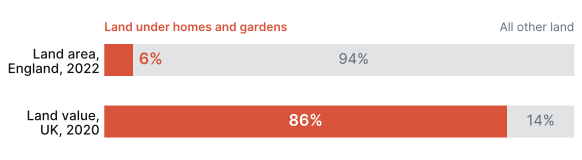
Homes and gardens against all other land. Area is for England, 2022; value is for the UK, 2020.
So the price list speaks fluently about land under houses and hardly at all about land under wheat, wetland or woodland. Those uses have a price, but it is a fraction of the developed one.
This is not the result of conspiracy. It is the logical response to the rules that govern how land is bought, sold and used. Nobody is protecting prices. The Bank of England's task is closer to the opposite: it caps high loan-to-income mortgage lending to keep the financial system resilient.17 Also, homeowners have a strong interest in stopping new building next door. Would-be buyers have an equally strong interest in it going ahead.18 As a result, the claimants who cannot outbid on price, which are food security, nature and the climate, depend on rules and on who is in the room when the rules are written.
The unwritten brief
So far this reads as a squeeze. Squeezes are where strategy gets interesting.
Ask most boards how their plan treats land, or the water, soil and habitat that go with it, and the answer is that it assumes there will be enough. Land is a line item, with adjacent considerations. That held while land was mostly a private matter between a buyer and a seller, with little adjacent trade-offs in the way. It is fraying. Housing will keep being settled by permission and price. Food security, nature and the climate will be settled by rules, targets, ministers and dissatisfied voters — and by whoever is at the table.
The rules are being written now. Scarcity is the unwritten brief.
Water companies have been practising. Severn Trent paid farmers in priority catchments to use less of a slug-pellet chemical, metaldehyde, that was reaching drinking-water sources, a scheme called Farm to Tap.19 A peer-reviewed study of three years of data, written by Severn Trent's own staff, found average concentrations at the treatment works fell by up to 61%, though concentrations in the catchments themselves were more variable, and that paying farmers for results achieved 12% more reduction than product substitution alone. Payments were up to £8 a hectare, and over those three years the company paid out just over £800,000 to farmers.
It does not always work. Between 2015 and 2020 South West Water and its partners put £25.9 million into catchment management through Upstream Thinking — £10.5 million of capital grants and £15.4 million of match funding — and drew up 864 farm plans in Devon and Cornwall. The University of Exeter's five-year evaluation, funded by South West Water, found only marginal modelled improvements across the catchments, up to 1.8% for sediment and 0.5% for phosphorus, and said the case has yet to be made for changes at catchment scale large enough to cut treatment costs.20 The lesson is not to drop the habit. It is to measure at the scale of the problem and to be wary of savings claimed before they are counted.
The water cases are not a perfect solution. They show a direction of travel.
What the two share is a problem with no single owner. A catchment, like a landscape, is a shared resource: the utility needs cleaner water, the farmer needs a market for the crop, the regulator needs a standard met, the charity needs a river that works. Each holds a piece of the problem. None holds the whole.
Economists call the arrangement that grows up around such resources polycentric governance: several centres of decision acting on the same thing without a single authority. Elinor Ostrom shared the 2009 Nobel in economics for her work on the commons, showing that communities can manage shared resources without privatising them or handing them to the state.21 The water cases are early, imperfect examples: a utility paying farmers is not a commons regime, but it is the same direction.
Widening who takes part is useful precisely where price alone cannot settle the question. It has costs. It takes time, it needs rules of engagement, and it disappoints people if outcomes do not arrive fast enough, or at all. For a shared resource it is worth paying, because the alternative is each party optimising its own slice until the resource is gone.
The UK's land is spoken for, but not yet divided.
References
-
Town and Country Planning Act 1947 (10 & 11 Geo. 6 c. 51), England and Wales; repealed and consolidated in the Town and Country Planning Act 1990. Agriculture Act 1947 (10 & 11 Geo. 6 c. 48), section 1; Part I, which provided the price guarantees, was repealed in 1993. https://www.legislation.gov.uk/ukpga/Geo6/10-11/51/contents and https://www.legislation.gov.uk/ukpga/Geo6/10-11/48/contents ↩
-
Office for National Statistics. Population estimates for the UK, England, Wales, Scotland and Northern Ireland: mid-2025. Released 1 October 2026. UK population 69,483,900; annual change 227,700 (+0.33%). https://www.ons.gov.uk/peoplepopulationandcommunity/populationandmigration/populationestimates/bulletins/annualmidyearpopulationestimates/mid2025 ↩ ↩2
-
Department for Environment, Food and Rural Affairs. Agricultural land use in the United Kingdom at 1 June 2025. GOV.UK; updated 17 December 2025. Utilised agricultural area 16.8 million hectares, 69% of the UK land area; croppable area 6.1 million hectares, defined as land under crops, temporary grass under five years old and uncropped arable land. https://www.gov.uk/government/statistics/agricultural-land-use-in-the-united-kingdom/agricultural-land-use-in-united-kingdom-at-1-june-2025 ↩ ↩2
-
Cassidy ES, West PC, Gerber JS, Foley JA. Redefining agricultural yields: from tonnes to people nourished per hectare. Environmental Research Letters. 2013;8(3):034015. doi:10.1088/1748-9326/8/3/034015. Delivered calories feed 6 people per hectare, produced calories 10.1 (section 3.2, table 2); calorie-based, 41 crops, around 2000. ↩ ↩2
-
Agriculture and Horticulture Development Board. GB harvest progress. https://ahdb.org.uk/cereals-oilseeds/gb-harvest-progress ↩
-
Department for Environment, Food and Rural Affairs. Agriculture in the United Kingdom 2025, chapter 14, The food chain, table 14.1c. Food production to supply ratio by value, all food: 60% in 2025, 65% in 2024. https://www.gov.uk/government/statistics/agriculture-in-the-united-kingdom-2025/chapter-14-the-food-chain ↩
-
Department for Environment, Food and Rural Affairs. United Kingdom Food Security Report 2024, Theme 2: UK food supply sources. GOV.UK; 2024. In 2023, 85% of the total utilised agricultural area was used for animal feed or animal production, counting all grassland and 58% of the croppable area. The report adds that it is generally not practical to convert non-croppable agricultural land to crops for human consumption. https://www.gov.uk/government/statistics/united-kingdom-food-security-report-2024/united-kingdom-food-security-report-2024-theme-2-uk-food-supply-sources ↩ ↩2
-
Centre for Alternative Technology. Zero Carbon Britain: Rising to the Climate Emergency. 2019, section 3 (about 7.4 million hectares of UK land used for food, of which 4.6 million hectares of cropland and 2.8 million hectares of grassland; imports reduced from 42% to 17% of food). https://cat.org.uk/info-resources/zero-carbon-britain/research-reports/zero-carbon-britain-rising-to-the-climate-emergency/ ↩
-
Department for Levelling Up, Housing and Communities. Land use statistics: England 2022. GOV.UK; 27 October 2022. Data at April 2022, England only: agriculture 63.1%, forestry, open land and water 20.1%, residential gardens 4.9%, residential buildings 1.3%. These are physical land use shares for England. Defra's 69% for UK farmland is a farm-holdings measure (utilised agricultural area), and the two are not interchangeable. https://www.gov.uk/government/statistics/land-use-in-england-2022/land-use-statistics-england-2022 ↩ ↩2
-
Convention on Biological Diversity. Kunming-Montreal Global Biodiversity Framework, Target 3. COP15, December 2022. ↩
-
Joint Nature Conservation Committee. Extent and condition of protected areas, UK biodiversity indicator. 2.60 million hectares of land and freshwater designated, 10.6% of UK land, at 31 March 2025. https://jncc.gov.uk/our-work/ukbi-protected-areas ↩
-
Climate Change Committee. The Seventh Carbon Budget. 26 February 2025. Balanced Pathway, table 7.4.2: proportion of UK agricultural land area required for land-based measures 10% in 2040 and 19% in 2050; proportion of UK land under woodland 13% in 2025, 16% in 2040 and 19% in 2050, excluding agroforestry and short-rotation forestry. Section 7.4: reduced livestock numbers, particularly cattle and sheep, release land for woodland creation, peatland restoration and energy crops; energy crops reach 0.7 million hectares by 2050. https://www.theccc.org.uk/publication/the-seventh-carbon-budget/ ↩
-
Ministry of Housing, Communities and Local Government. Planning overhaul to reach 1.5 million new homes. Press release, 12 December 2024. https://www.gov.uk/government/news/planning-overhaul-to-reach-15-million-new-homes ↩
-
The Royal Society. Multifunctional landscapes: Informing a long-term vision for managing the UK's land. 1 February 2023, p. 17. https://royalsociety.org/news-resources/projects/living-landscapes/multifunctional-land-use/ ↩
-
Office for National Statistics. Improving estimates of land underlying dwellings in the national balance sheet, UK: 2022. Released 10 March 2022. Land underlying dwellings £5.4 trillion; total land £6.3 trillion, in 2020. Gardens integral to a dwelling are included in this land. https://www.ons.gov.uk/economy/nationalaccounts/uksectoraccounts/articles/improvingestimatesoflandunderlyingdwellingsinthenationalbalancesheetuk/2022 ↩
-
Barker K. Barker Review of Housing Supply: Final Report, Recommendations. HM Treasury; 17 March 2004. Hilber CAL, Vermeulen W. The impact of supply constraints on house prices in England. The Economic Journal. 2016;126(591):358–405. doi:10.1111/ecoj.12213 ↩
-
Bank of England. The contribution of the Financial Policy Committee to UK financial stability. Quarterly Bulletin. 25 September 2024. https://www.bankofengland.co.uk/quarterly-bulletin/2024/2024/the-contribution-of-the-fpc-to-uk-financial-stability ↩
-
Fischel WA. The Homevoter Hypothesis. Cambridge, MA: Harvard University Press; 2001. ↩
-
Cooke A, Rettino J, Flower L, Filby K, Freer A. Farming for water; catchment management initiatives for reducing pesticides. Water and Environment Journal. 2020;34(4):679–691. doi:10.1111/wej.12609. Payments up to £8 per hectare of enrolled land; £808,362 paid to 1,406 farmers over three years (table 3). ↩
-
University of Exeter. Upstream Thinking: Evaluating the impact of farm interventions on water quality at the catchment scale. 2021. Centre for Resilience in Environment, Water and Waste. Funded by South West Water. ↩
-
Ostrom E. Governing the Commons: The Evolution of Institutions for Collective Action. Cambridge: Cambridge University Press; 1990. Ostrom V, Tiebout CM, Warren R. The organization of government in metropolitan areas: a theoretical inquiry. American Political Science Review. 1961;55(4):831–842. Sveriges Riksbank Prize in Economic Sciences in Memory of Alfred Nobel, 2009. ↩